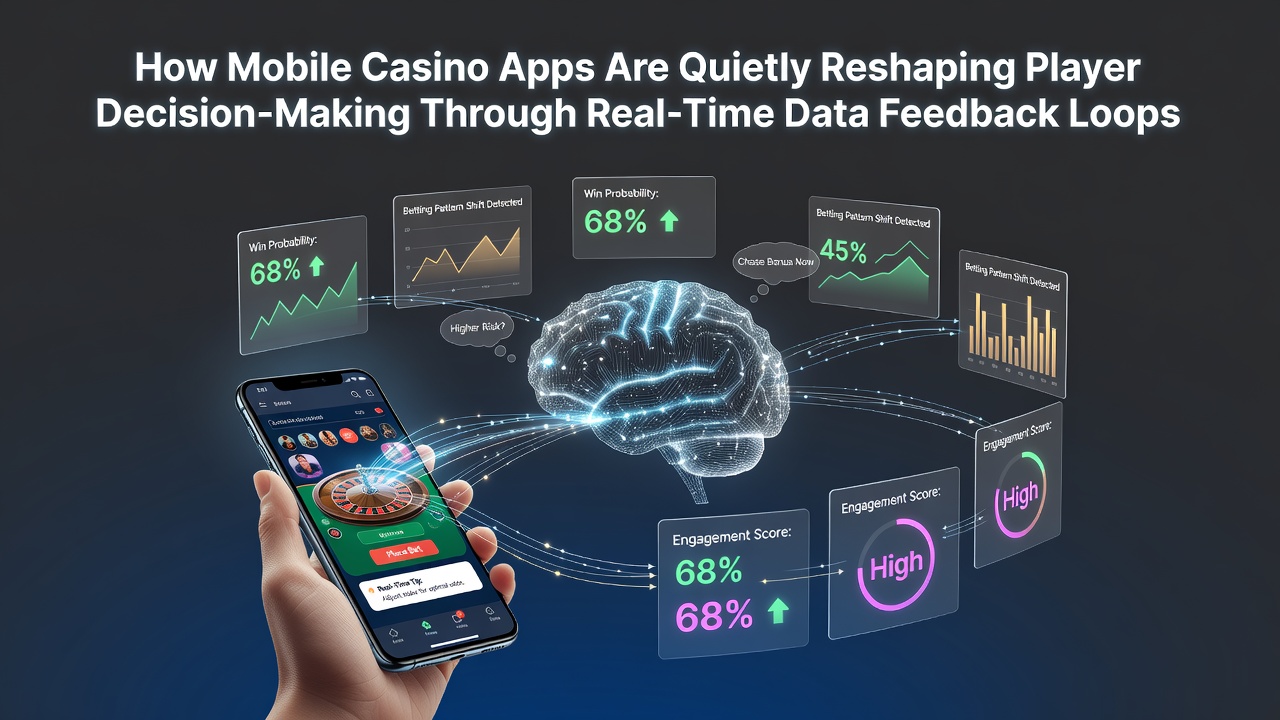
Instant Data Feedback Loops Driving Shifts in Mobile Casino Player Choices
Real-time data feedback loops operate through continuous collection of user inputs such as bet sizes, session durations, and game selections followed by immediate presentation of tailored metrics back to players via app interfaces. These systems process information from device sensors and server logs to generate updates that appear within seconds of each action, creating closed circuits where past behavior informs present options without requiring external prompts. Industry analyses from the New Jersey Division of Gaming Enforcement document how these loops integrate with core gameplay mechanics across multiple platforms operating in regulated markets.
Core Components of Feedback Systems
Apps track metrics including win rates, average wager amounts, and time spent on specific titles then convert those figures into visual summaries like progress bars or heat maps that update live during play. Developers build algorithms that adjust notification frequency based on detected patterns such as prolonged losing streaks or sudden spikes in activity, and these adjustments draw from aggregated data pools maintained on secure cloud servers. Research compiled by the Canadian Centre for Gaming Research indicates that such mechanisms reduce decision latency by presenting comparative statistics against prior sessions in the same interface window.
Device hardware contributes additional layers through accelerometer readings that detect hand movements during taps and gyroscope data that logs orientation changes while players navigate menus. Software layers merge this hardware input with server-side records of deposit patterns and withdrawal requests to form comprehensive profiles updated every few minutes. Observers note that the resulting feedback appears as in-game overlays or post-round summaries rather than separate dashboard screens, which keeps the loop embedded within the primary user flow.
Mechanisms Affecting Choice Patterns
Players encounter suggested bet adjustments derived from their historical data sets, where the app calculates optimal stake ranges based on recent performance indicators and displays them alongside standard options. These suggestions rely on statistical models that factor in volatility measures from chosen games and cross-reference them against global session averages collected anonymously from similar user cohorts. Figures released in industry reports show increased frequency of mid-session stake modifications when such comparative data appears on screen.
Session timers combined with expenditure trackers create visible thresholds that trigger color-coded alerts once predefined limits approach, prompting users to review accumulated totals before confirming further wagers. The loops close when player responses to these alerts feed back into the model, refining future threshold placements according to observed compliance rates. Data compiled through academic partnerships with institutions in Australia reveals that apps incorporating these dynamic alerts record measurable changes in average session lengths across tested user groups.

Implementation Across Platforms in Mid-2026
By July 2026 multiple operators had expanded integration of feedback modules into live dealer environments, where real-time win probability estimates appear alongside video feeds derived from card shuffle algorithms and betting histories. These estimates update after each hand using encrypted data streams that maintain compliance with jurisdictional requirements outside the United Kingdom. Platform logs indicate that users interact with probability displays more frequently during extended sessions, leading to documented shifts toward lower-volatility selections in subsequent rounds.
Cross-device synchronization extends the reach of these loops by carrying profile data between phones and tablets, ensuring continuity of feedback displays regardless of hardware switches during a single day. Developers employ standardized APIs that preserve metric integrity across operating systems, and testing conducted by European trade associations confirms consistent performance when sessions span multiple device types. The continuous nature of data exchange means decisions made on one screen influence recommendations presented on another without manual intervention.
Observed Outcomes in User Behavior
Analytics from aggregated platform data demonstrate that exposure to immediate performance graphs correlates with higher rates of voluntary session pauses at predetermined intervals. Users receive summaries that compare current results against personal benchmarks established over previous weeks, and these comparisons often precede adjustments in game type or wager frequency. Reports from research groups tracking North American markets highlight similar patterns emerging in jurisdictions where real-time reporting tools gained regulatory approval earlier in the decade.
Feedback loops also influence deposit behaviors through display of running totals that incorporate both wins and losses in a single view updated after every transaction. Players encounter these consolidated figures before confirmation screens load, which introduces an additional review step into the funding sequence. External audits performed by independent testing labs verify that the displayed figures match backend ledgers exactly, preserving accuracy across high-volume transaction periods.
Conclusion
Real-time data feedback loops continue to embed themselves deeper into mobile casino app architectures through iterative updates that prioritize speed and relevance of presented information. Regulatory frameworks in various regions adapt alongside these technical developments by requiring transparency in how algorithms derive suggestions from user data. The resulting environment features decision points increasingly shaped by instantaneous metric displays that draw from both individual histories and broader statistical pools.